Powering your Salesforce reports using the PARENTGROUPVAL function
12 February 2016
How to Use the PARENTGROUPVAL function
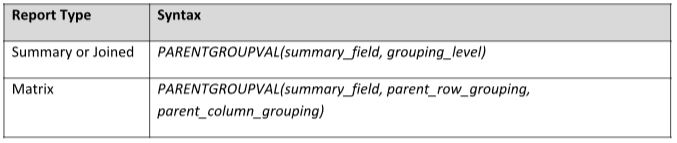
The ParentGroupVal function is one of the lesser known features of Salesforce reporting. In this article you will learn how to create some key metrics for summary reports by using the PARENTGROUPVAL function within a summary, joined or a matrix report. The function obtains the summary value from a parent group, which is a grouping that is a level above the current grouping. The syntax varies based on the report type in context:
Case I:Tracking Lead Source effectiveness
Consider the case where an organization wishes to track the Lead Source effectiveness, and to do that it tags all of its Leads with a Lead Source. If management would like to know the percentage contribution of each lead source towards the total lead count – conceptually you could envision this as a summary report, grouped based on Lead Source. However to get the percentage figure, you would need to divide the count of leads per source, by the total number of leads. In this case, PARENTGROUPVAL would help you get the total number of leads (denominator). Let’s see how:
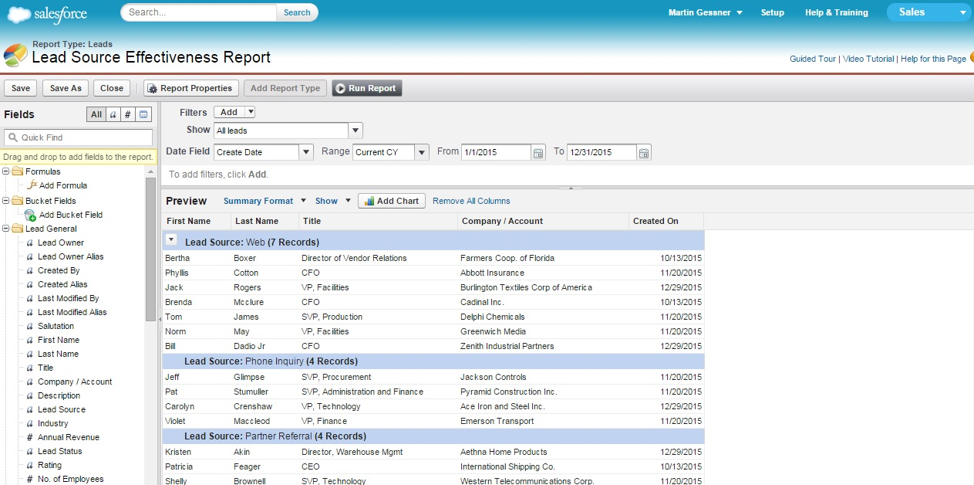
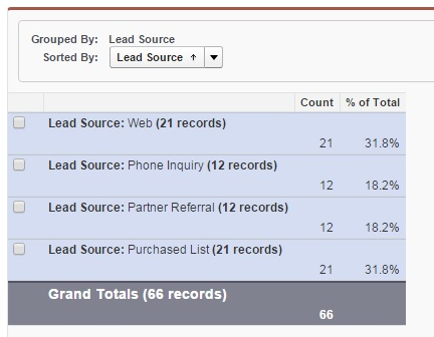
STEP 1: Construct a summary report based on a Leads report type, grouped by theLead Source field.
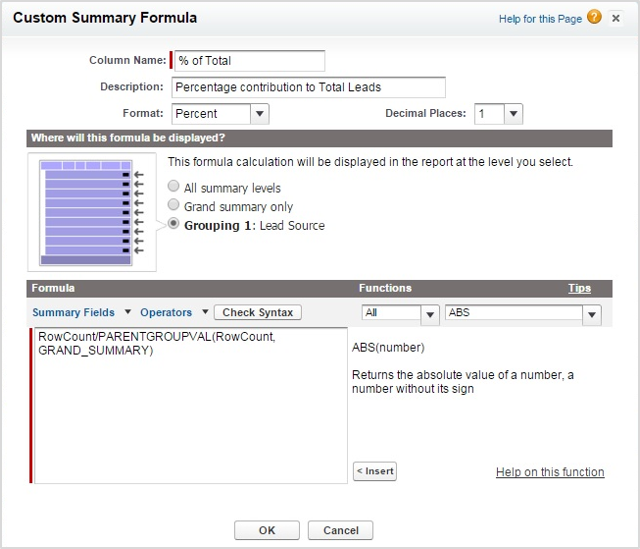
STEP 2: Use a custom formula field to extract the percentage contribution of a lead source versus the total lead count.
Now, you have your group level summaries, for instance, you know Lead Source = Web gave you seven leads over the current calendar year. This is where you would use the PARENTGROUPVAL function to obtain the grouping total. Here there is only one level of grouping, so we are simply looking at extracting total from the grand summary level, so your custom formula field definition would look like this:
Note that if you are using point and click to add the PARENTGROUPVAL function from the functions menu, you would get a default syntax like: PARENTGROUPVAL(summary_field, GRAND_SUMMARY).
Here, the ‘summary_field’ is a placeholder that needs to be replaced with the field for which you need the summary. In our case, it is RowCount, which is also a custom field (shown for clarity sake). It should give you a report like this:
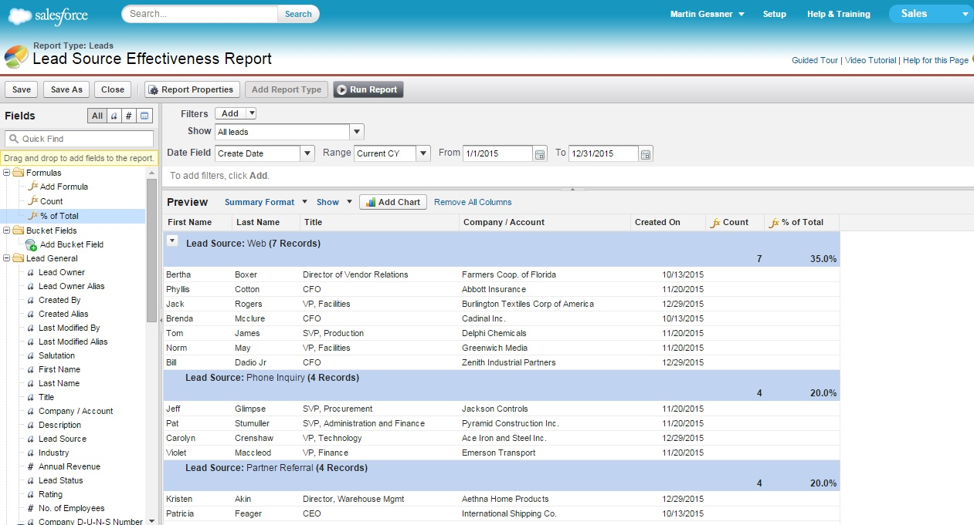
STEP 3: Run the report and hid the details to obtain a clean summarized representation of Lead Source effectiveness.
So now we can identify the lead source contribution in quantified terms, we used PARENTGROUPVAL function to obtain the GRAND_SUMMARY;
Similarly, PARENTGROUPVAL function can be used for variety of cases such as:
✓ Monthly Sales Volume ✓ Case Closure per User ✓ Leads Lost Reason ✓ Opportunity Pipeline spread ✓ Etc.
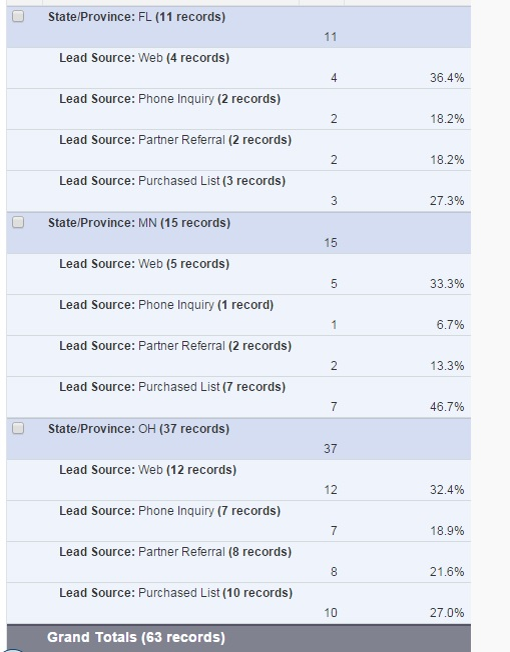
Case II: Obtaining the percentage spread within a subgroup.
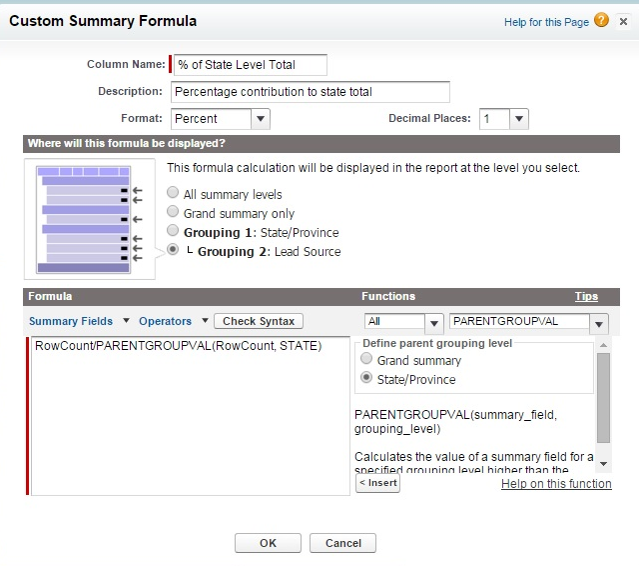
For instance, using a summary report to represent the lead source effectiveness by states; in order to find the percentage contribution within a state, we now have to use PARENTGROUPVAL to find the summaries at the state level, and not at a grand summary level.
The formula field established in this case looks as shown below, notice how the PARENTGROUPVAL summary_field is populated to establish the subgroup total. Thanks to the intuitive formula authoring applet, you can construct the PARENTGROUPVAL structure through point and click..
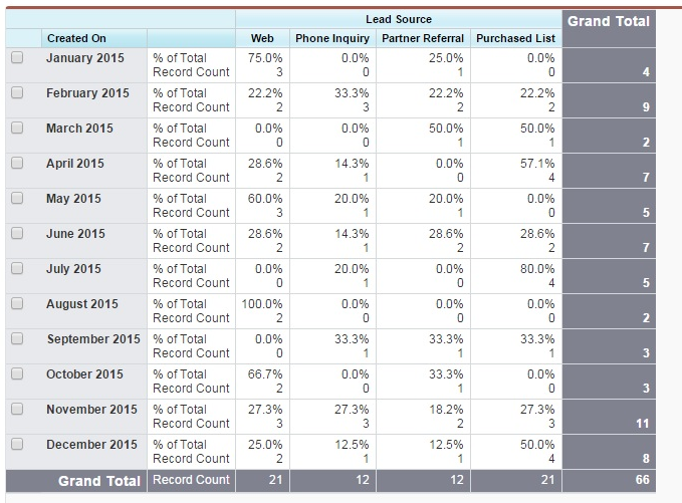
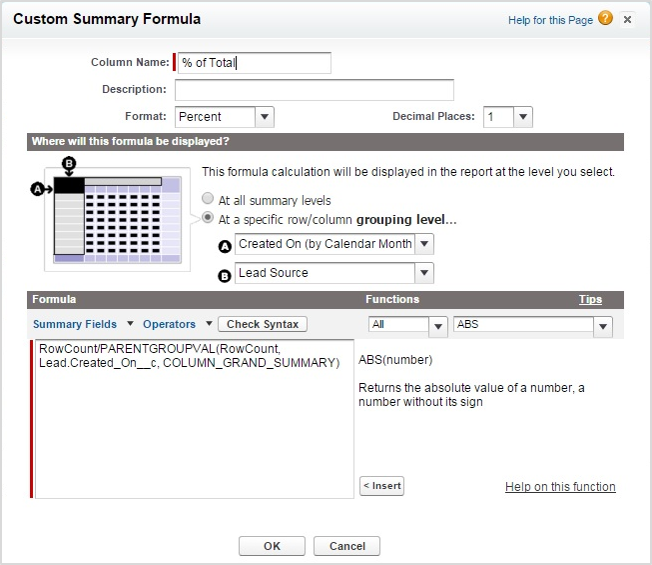
Case III:Usage of PARENTGROUPVAL in a matrix report.
Here, the same metrics are plotted on a matrix report split across calendar months.
The custom formula field setup is shown below:
How have you used the ParentGroupVal function ins reports? Share in the comments below.
What Certification are you studying for now?
Focus on Force currently provides practice exams and study guides for sixteen certifications
He has spent over 10 years working in various Salesforce roles including business analyst, project manager, consultant and solutions architect. Along the way he has earned twelve certifications, published "The Salesforce Career Playbook", and helps Salesforce professionals learn more about Salesforce, develop their career and prepare for certifications.
Like what you’ve read?
Share it with your network!
Comments
Zach Stafford
This was great! Lightning report builder doesn’t have the guide that Classic report builder does and that made the difference. The visualization on Classic really helped! Thanks!
Google Tag Manager (GTM) is Google’s free tool for everyone to manage and deploy analytics and marketing tags as well as other code snippets
using an intuitive web UI.
×
Email Notification Settings
Control how you receive company email alerts for credit redemption events.


This was great! Lightning report builder doesn’t have the guide that Classic report builder does and that made the difference. The visualization on Classic really helped! Thanks!