You may have the requirement to report by month and year. If you have tried that, you will find that the standard reporting features may not provide you with what you are looking for.
Lets say that you would like to report on the number of closed opportunities over the last 3 years. You would like to have months reported along the top in columns and the years down the side in the rows. The report will just include the number of opportunities closed in each of the months.
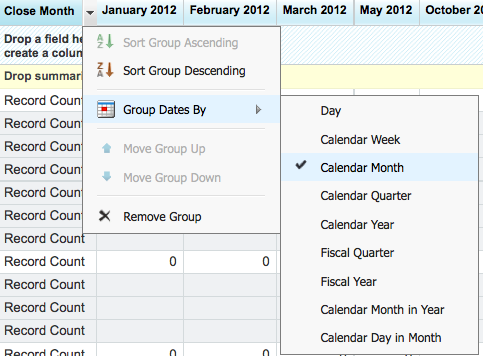
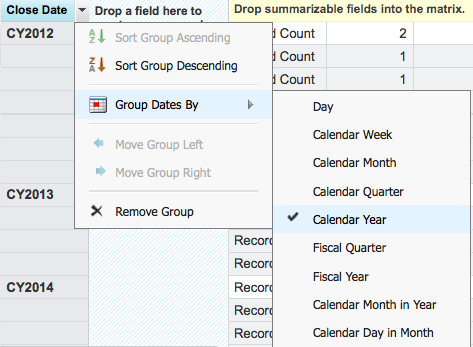
You work out you need a matrix report and need to group by close month for a column grouping and close date for the row grouping. You also work out you need to use the ‘Group Dates By’ feature of ‘Calendar Month’ for the Close Month and ‘Calendar Year’ for the Close date row grouping.
Calendar Month Grouping
Calendar Year Grouping
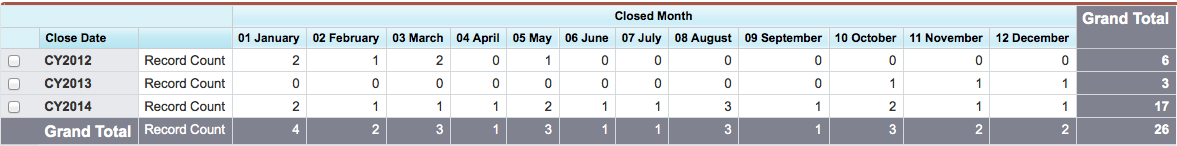
Your first attempt may look something like this:
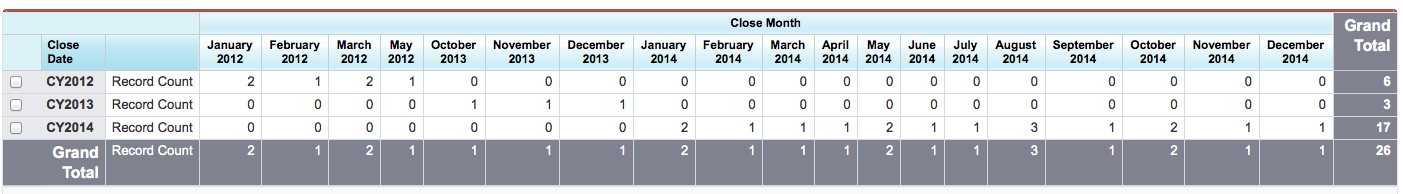
Then you realize you need to do a little more work. The problem is that while the report is grouped by calendar month, it is not exactly what you had in mind. It is grouping by every month of every year that is being reported. You had wanted to just see January to December as months in the columns, but it is reporting on each month from January 2012 to December 2014.
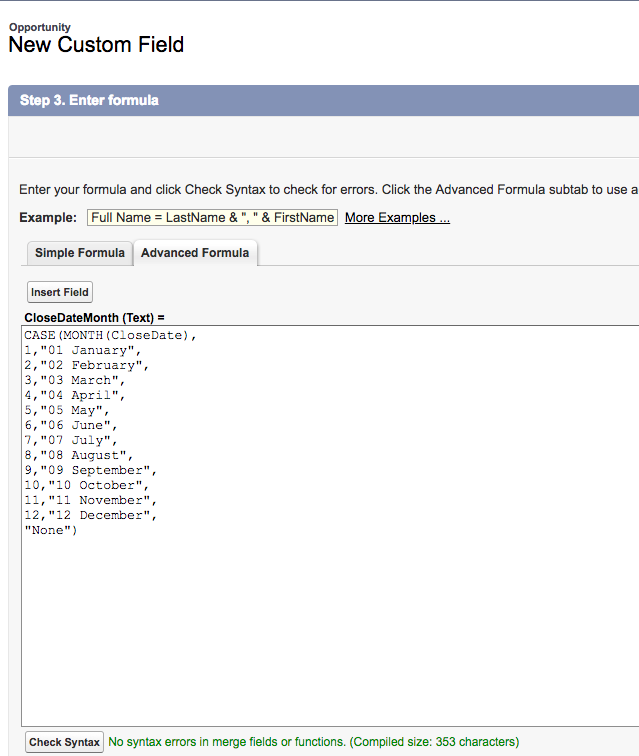
To improve this, we can add a formula field to the opportunity object, that will calculate the month that the opportunity closed date is in, and then we can use this for reporting.
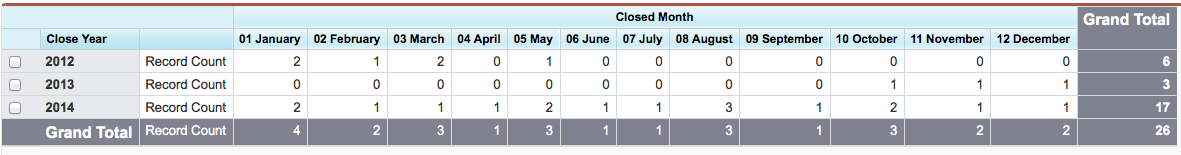
Now we can replace the column grouping with our new field, and here is the result:
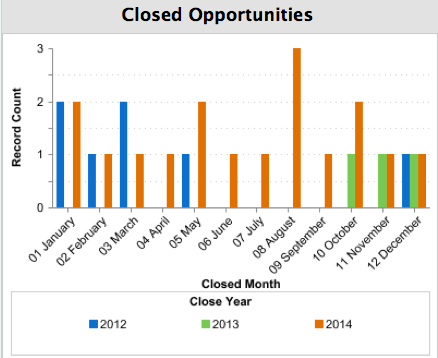
The last thing you may want to do is to create a dashboard, that shows graphically the number of opportunities per month and groups by year, so it is possible for example, to compare the number of closed opportunities in January 2012 to January 2013 and January 2014. While we were able to use the ‘Group Dates By’ feature in the matrix report, this isn’t available in a dashboard. To deal with this, we need to create another formula field that will return the year of the close date. Here is the formula:
![]()
![]()
Note it is a text field. If we used a numeric field, then the years would be formatted as numbers e.g. 2,014.
Now we have our Year calculation we can use it for the row grouping, and our report now looks like this:
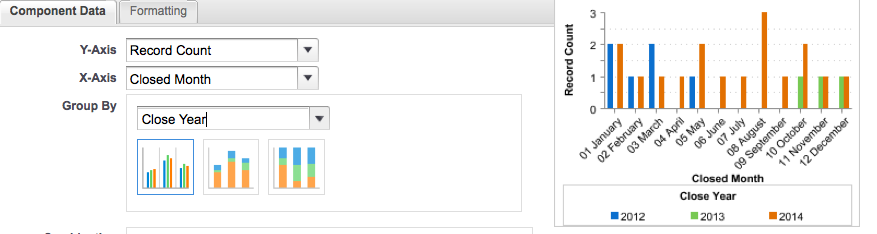
And with that, we can create our dashboard using our report as the data source. In the component date, we set the X axis to the Close Month and Group by to the Close Year.
Now finally we have our dashboard, where we can compare the number of opportunities closed by month and year.
What Certification are you studying for now?
Focus on Force currently provides practice exams and study guides for sixteen certifications