
Have you ever come across the need to do actual vs target reporting in Salesforce? It could be to report on if Salespeople are reaching their targets for the value of closed opportunities. It could be whether the number of orders has reached the goal for the month. Another example could be the number of qualified leads created. While it is easy to create reports that summarize actual data, how can we report on that data vs a target?
In this post we will be looking at how to use Custom Summary Formula fields as a means to generate a simple Target vs. Actuals Lead inflow report. Custom Summary Formula fields are an often under estimated tool in Salesforce reporting. Custom Summary Formulas are a powerful reporting technique for summary and matrix reports to calculate additional totals based on the numeric fields available in the report.
An organization may have customer acquisition targets, which are measured in terms of the number of leads brought in per agent. While you can build a simple summary report to represent the number of leads brought in per month – to view this against the total quota for the month, you need to put together a solution involving a few components. Let’s see how we achieve this use case using custom summary formula fields as the central part of the solution.
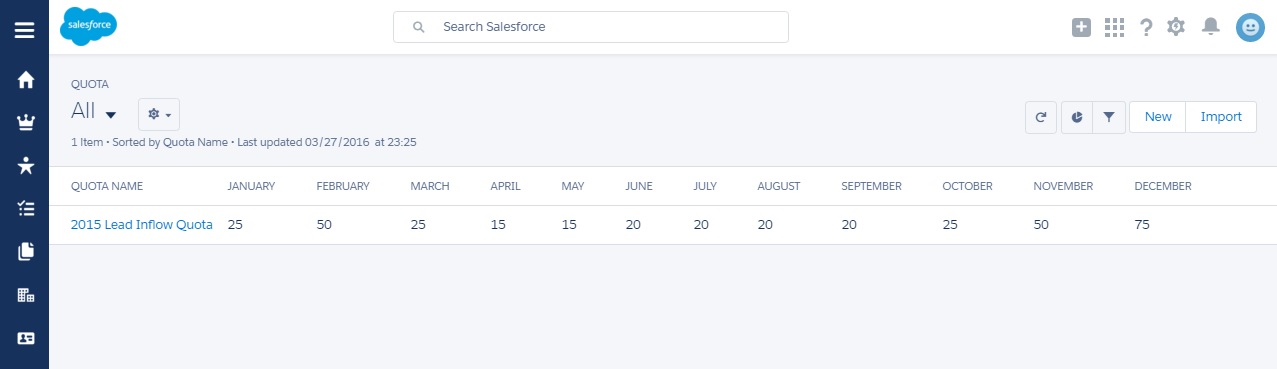
Firstly, we need somewhere to hold the quota definition. We would like to make the quota data managable and not hardcode it in the actual report, so that it can be updated and extended each year easily. To achieve this, we will use a custom object to hold quota definitions for each month. Consider a simple design with one record representing a year, and 12 fields within the records holding quota targets for each month.
In order to report on the leads and the quota data, we need to associate each lead record with the appropriate quota record (based on the Lead created data year) when the lead is created. This association could be done with a lookup field on the Lead record, and populated with an automation tool.
Now, a simple custom report type, exposes all Lead fields, along with the lookup fields from the quota object – which are the individual monthly quota values. The advantage of this solution is that the Quota field values are read when the report is run, so it will always use the latest values. This report type is used to create a regular lead summary report grouped by Calendar Months.
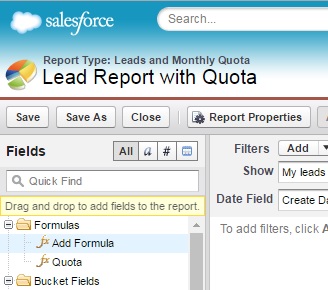
Adding a bar chart at this point would display all record counts, per month. Now we need to produce an additional column alongside each of the monthly record counts.
This is where the custom summary formula field comes in.
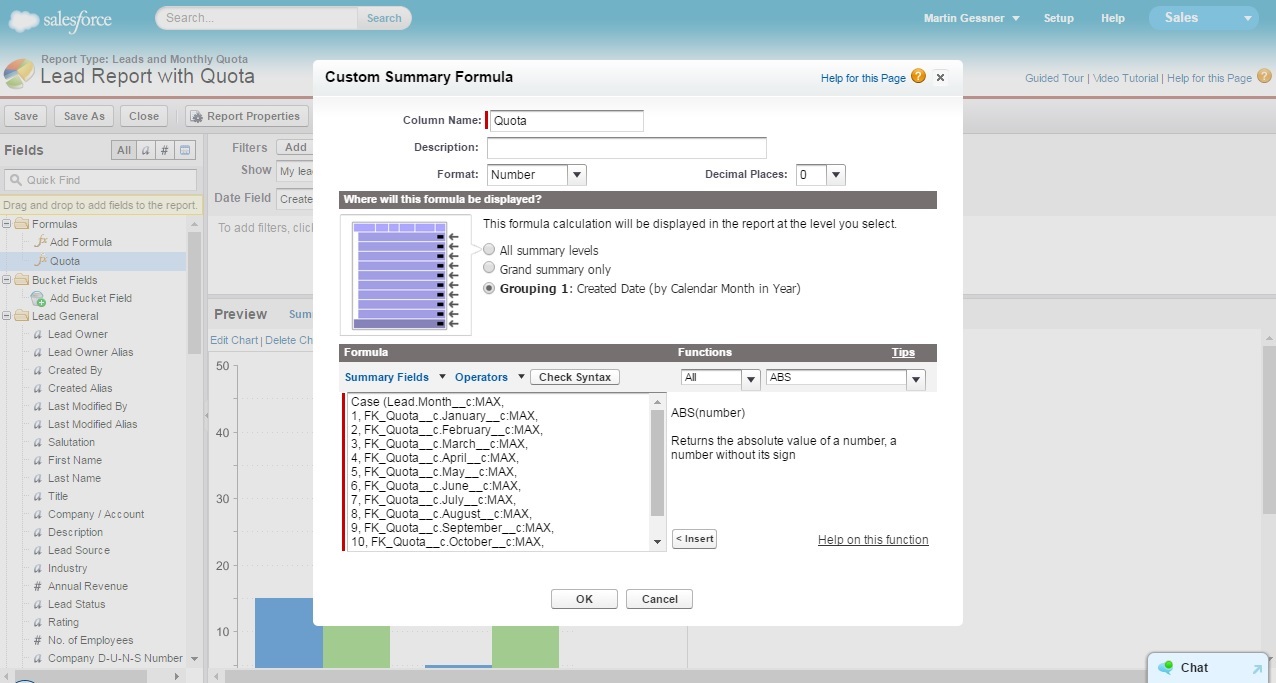
In the custom summary formula shown above, a custom formula field “Lead.Month__c” is used to obtain monthly quota values. This field represents the month numeral for created date; and could be obtained through the simple formula:
MONTH (CreatedDate)
Also, since the lead record is linked to a “quota” record, and we are using a Custom Report Type that inherits fields from the associated Quota record; the custom summary formula field can be created as above.
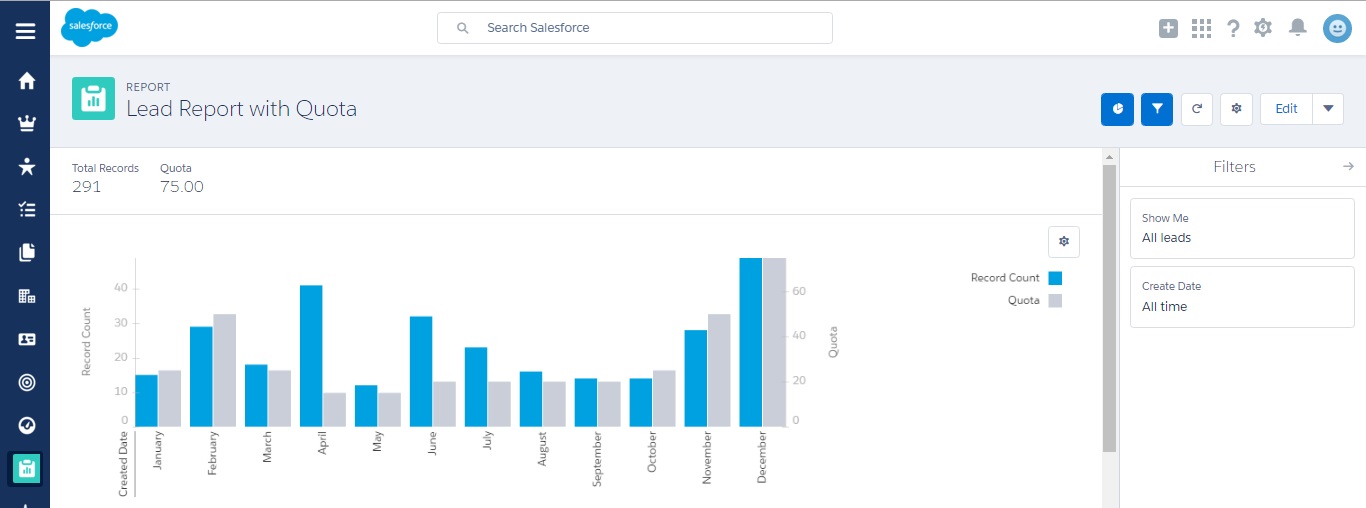
Now, adding a chart with multiple data axis, will achieve the desired Lead Inflow Actuals vs Target representation.
What Certification are you studying for now?
Focus on Force currently provides practice exams and study guides for sixteen certifications


I’m looking to set this up in our org for Opportunities. What the best way to automatically link a quote record with an Opportunity record using Process Builder?